Test Procedure
Figure 1 shows the test set-up used. A constant voltage of 200mv RMS was
maintained from the waveform generator and applied to the receiver #1
input of each controller across all frequencies. The receiver level was
adjusted for a internal audio bus level of 200mv. The output level (TX#1)
was adjusted for a 0dB reading at 1000Hz on the distortion analyzer
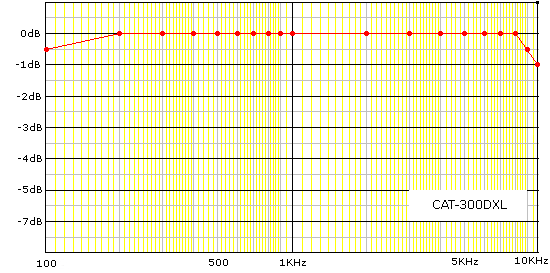
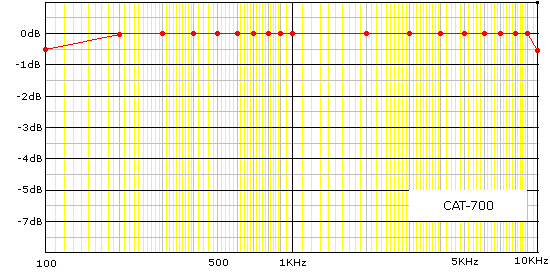
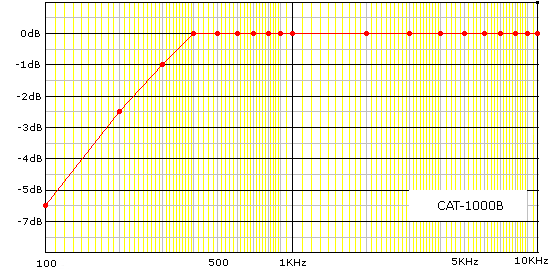
as a reference point. Readings were then plotted between 100Hz and 10KHz
(see charts below for each controller) for each controller. Distortion
measurements were noted and recorded at 100, 500, 1,000, 5,000, and 10,000
Hertz. Units under test were pulled randomly from finish-goods stock.
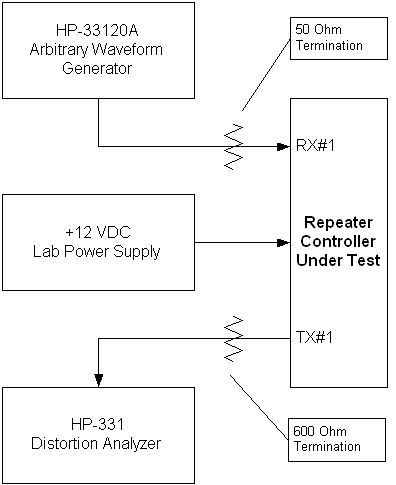
Figure 1 Test Setup
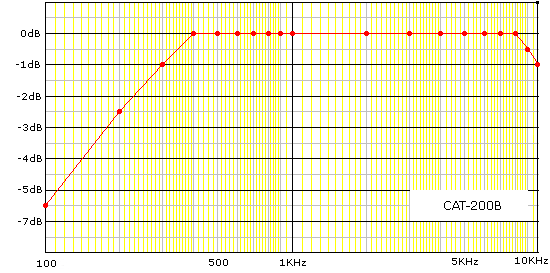
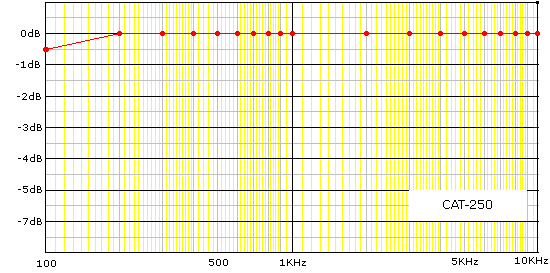
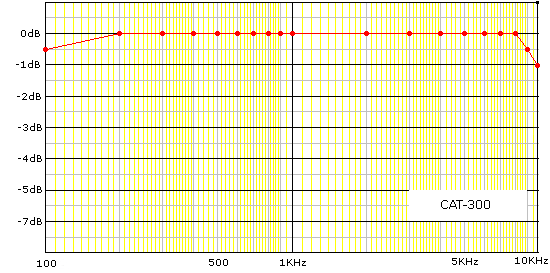
Repeater Controller Audio Distortion


